Transportation electrification (TE) is changing rapidly. And utilities are looking to shape the future of clean transportation and prepare for the new loads from these technologies. It’s been complicated and time consuming to find detailed data about what utilities are spending on TE and where they’re focusing their program efforts.
To gather this information and make it easy for you to find and analyze it, E Source has created TE Insights in support of our new Mobility Service. The tool organizes data from utility TE plans (TEPs), EV-specific rates, and customer rebates into one easy-to-navigate platform for a wide range of users. We’ve designed the tool to offer insights relevant to different roles at utilities and solution providers.
TE portfolio managers and EV strategists
As you’re developing your own TE portfolio, TE Insights can help you understand other utilities’ portfolios and find strategies to respond to your regulators.
Data visuals, slicers, and exported results help you explore spending and goals
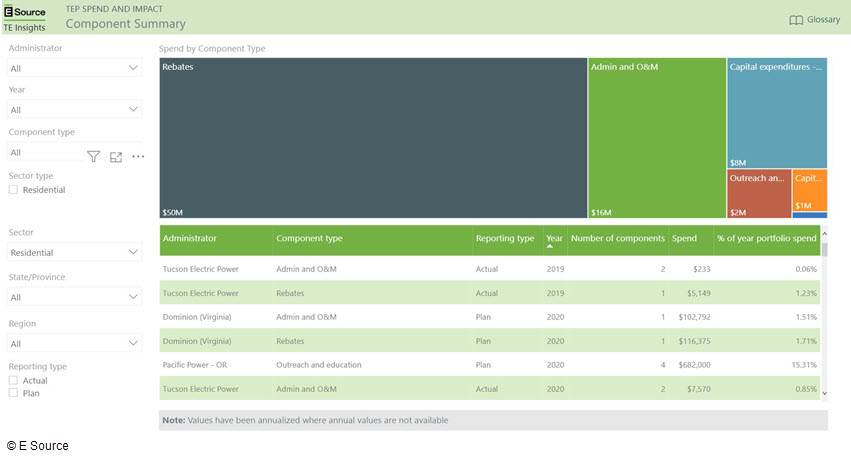
With dynamic visuals, you can quickly see how utilities are allocating TEP budgets between rebates, capital investments, outreach and education, and more (figure 1). Slicers make it easy to focus on budgets and goals for different utilities, regions, sectors, impact types, and more. If you want to analyze the data yourself, you can export your chosen data to Microsoft Excel to explore it in more detail. Also, each data point has links to the right page in the reference document so you can see more context about each value.
Figure 1: Spend by component type filtered by residential spending
The Document Library supports your portfolio development
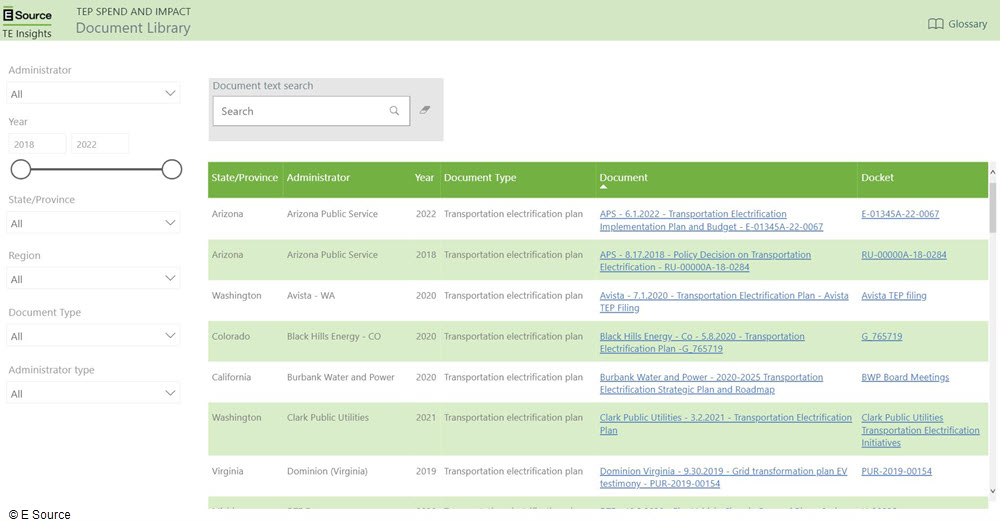
The Document Library compiles TEPs, major TE filings, reports, and evaluations so you can easily find examples of how other utilities are building the case for their TE investments and responding to their regulators (figure 2). You can also do a keyword search across all documents stored in TE Insights to find mentions of specific technologies or utility concerns.
Figure 2: Document Library
EV program managers
Perhaps you’re not building out a whole TE portfolio just yet but instead benchmarking your current EV programs or designing a new one. TE Insights makes it easy to compare and navigate current utility offerings.
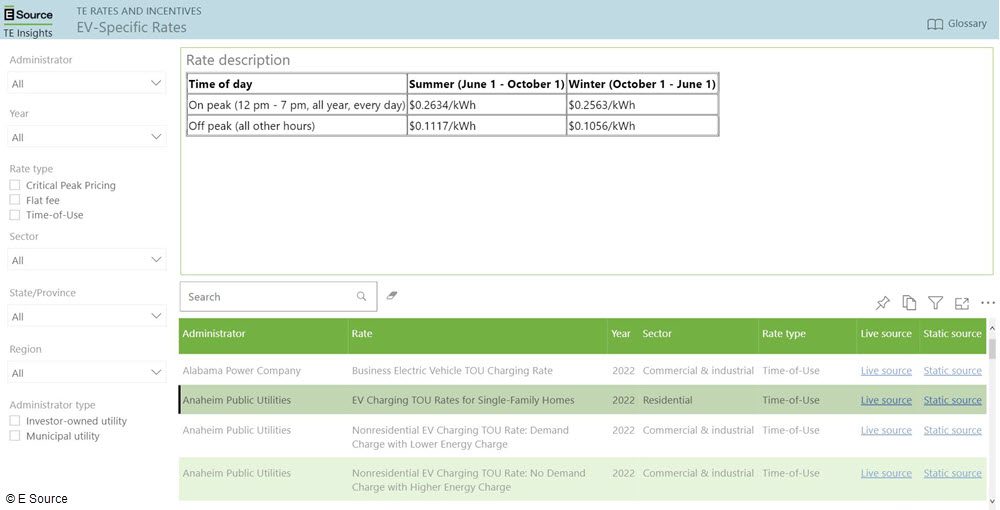
Selecting a rate or program from the lists on the EV-Specific Rates and EV Incentive Programs dashboards pulls up a program description, and it’s easy to navigate to the next item on your list. You can also search the program table for keywords (figure 3).
Figure 3: EV-Specific Rates dashboard
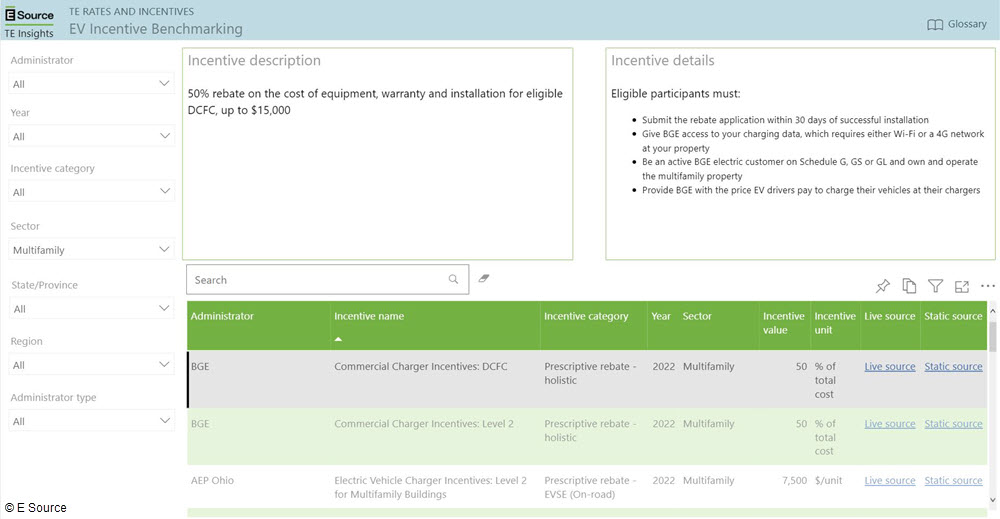
The EV Incentive Benchmarking dashboard includes specific incentive amounts from EV programs so you can compare them to your existing or new incentives (figure 4). Incentives range from e-bike rebates to funding for DC fast-charging installation.
Figure 4: EV Incentive Benchmarking dashboard
Solution providers
TE Insights helps you identify trends in utility investment and find filings for future programs and spending. Filter documents or portfolios by year to identify plans for future investment (figure 5). Or use visuals to quickly see where utilities are prioritizing spending. With slicers, you can narrow down to the specific utilities, regions, and sectors that are most relevant to your business. The Document Library keyword search also helps you find mentions of specific technologies to find utilities looking for your solutions.


